|
|||||||||||||
|
Name
Cash Bids
Market Data
News
Ag Commentary
Weather
Resources
|
Lyft Generates Huge FCF Margins - LYFT Stock Is Too Cheap/Lyft%20logo%20on%20phone%20by%20Thought%20Catalog%20via%20Unsplash.jpg)
Lyft, Inc. (LYFT) generated strong free cash flow (FCF) growth in Q2, and its FCF margins have risen. Even though LYFT stock has risen, it's still off recent highs. It looks too cheap here. Investors may want to buy in-the-money calls and short OTM puts. This article will show how to play LYFT stock. LYFT closed at $15.82 on Friday, Aug. 15, up +8.2% on the day and also up +13.0% ($13.99) since it released the Q2 earnings results on Aug. 6. But it still may have further to go. 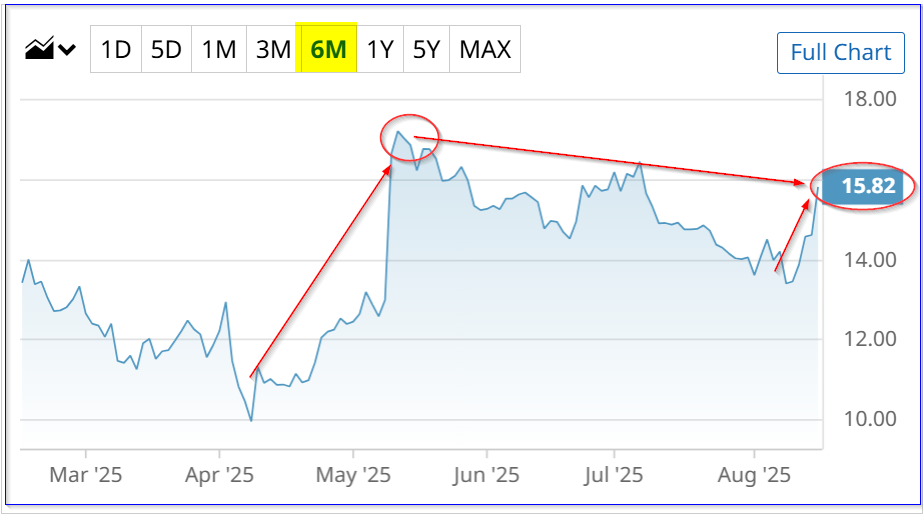
Given its strong FCF margins, the LYFT stock target price could be worth +24.4% more at $19.68. Let's look at this further. Strong LYFT FCF and MarginsLyft's revenue was up 11% year-over-year (Y/Y) and bookings rose 12%, which led to $40.3 million in net income vs. last year's $5.0 million. However, more importantly, it has now been free cash flow (FCF) positive for 5 straight quarters. It generated $329.4 million in FCF in Q2, which was +17.3% higher than Q1 and +28/5% higher Y/Y. That also led to very strong FCF margins, over 20% of revenue, as can be seen in the table below, taken from page 16 of Lyft's Q2 supplemental slide presentation. 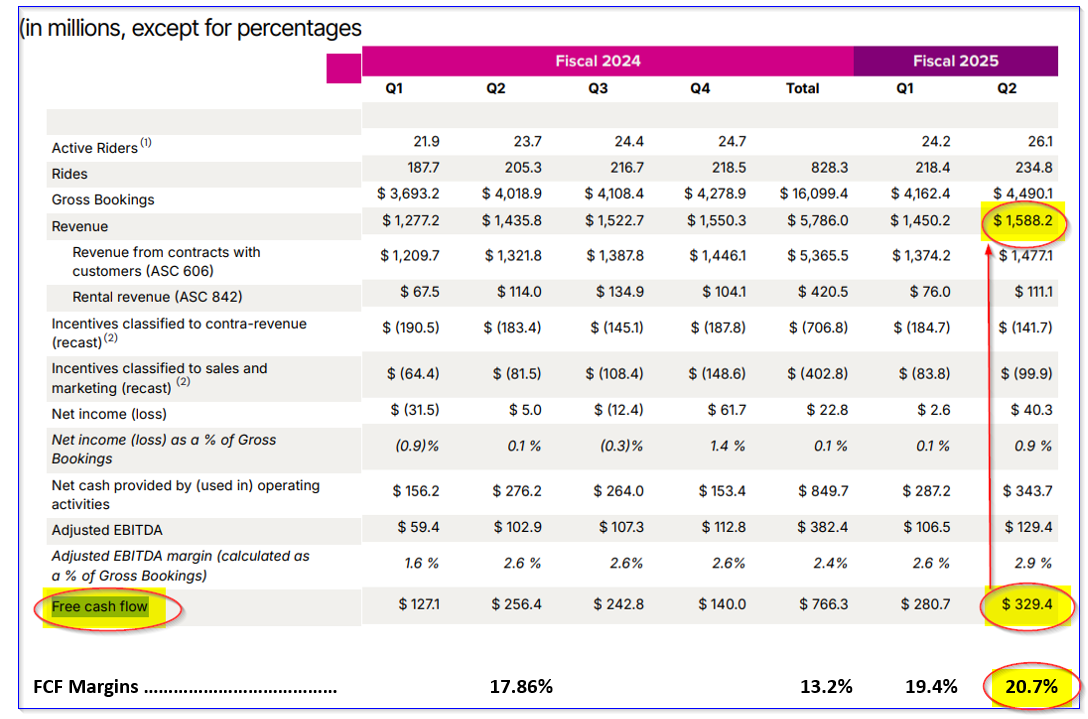
Moreover, Lyft highlighted its trailing 12-month (TTM) FCF. The company said on page 6 of its prepared remarks that it encourages looking at the TTM FCF figures, as the timing of insurance payouts can make the quarterly FCF figures vary. It generated $993 million in TTM FCF. That was +7.9% higher than last quarter's $920 million TTM FCF. 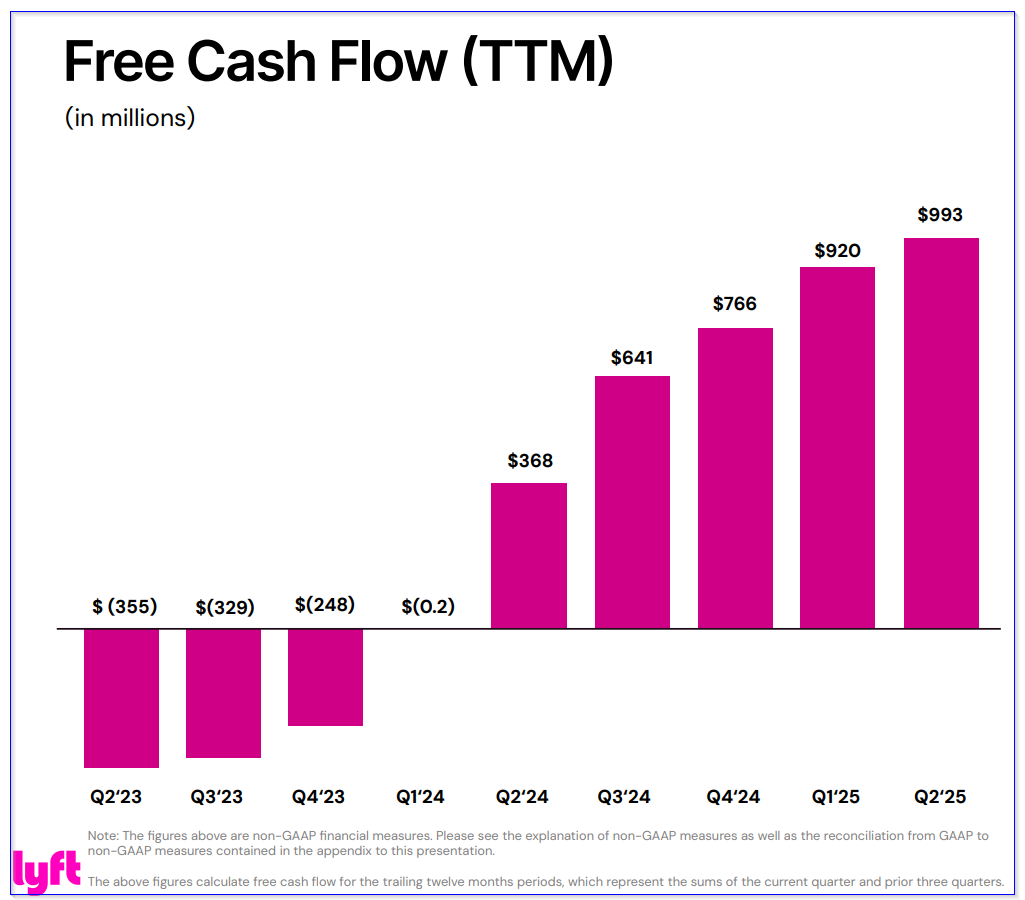
More importantly, that worked out to a TTM FCF margin of 16.25% of TTM sales of $6.111 billion. That was much higher than the 15.44% TTM margin last quarter and the 13.22% FCF margin in 2025. These numbers can easily be seen on the Stock Analysis Trailing 12 Month Cash Flow data page. The point is that the company is continuing to squeeze out higher levels of cash from its operations as its revenue rises. That is clear evidence of operating leverage, since its costs don't rise as fast as revenue. That means we can predict higher levels of FCF for the company going forward. Forecasting FCF Using FCF MarginsFor example, analysts are now projecting revenue will rise to $6.52 billion this year, up from $6.48 billion three months ago (see my May 13 Barchart article). They also foresee $7.40 billion for 2026 (up from $7.20 in May). As a result, we can project FCF for both years, using a 16.25% annual FCF margin (even though it made a 20.7% margin in Q2 and 19.4% in Q1, or an average of 20.05% in H1): $6.52 billion revenue 2025 x 16.25% FCF margin = $1.0595 billion FCF 2025 $7.40 billion 2026 x 16.25% = $1.2025 billion FCF 2026 As a result, for the next 12 months (NTM), the average FCF will be $1.131 billion. Keep in mind that if FCF margins rise to 19% or more, this could skyrocket to between $1.2388 billion in 2025 to $1.406 billion in 2026, or $1.322 billion over the next 12 months. So, on average, let's assume it rises to $1.23 billion, or 23.9% higher than the $993 billion in TTM FCF. This could lead to a significantly higher stock price. Target Price for LYFT StockOne way to value a company's FCF is to assume that it pays out 50% of the FCF to shareholders. In fact, management has already said it is on track to buy back $500 million for shareholders by next May. That's roughly half of the $1.05 billion it may generate in 2025. Moreover, let's assume the market may eventually give LYFT stock a 15.0% FCF yield (i.e., FCF divided by the market cap). For example, the $993 million in TTM FCF in Q2 represents 15.4% of its present $6.43 billion market cap. This is the same as multiplying the FCF by about 6.5x (i.e., 1/0.154 = 6.493). So, let's multiply our FCF estimate by 6.5x: $1.23 billion NTM FCF x 6.5 = $8.0 billion market cap That works out to +24.4% more than today's market value of $6.43 billion, according to Yahoo! Finance. In other words, LFYT stock could potentially be worth +24.4% more than its price today over the next 12 months: $15.82 price 8/15/25 x 1.244 = $19.68 target price Analysts Agree LYFT is UndervaluedFor example, Yahoo! Finance reports that 40 analysts have an average price target of $17.05. Other surveys include Barchart's survey mean of $17.06, and Stock Analysis ($16.98) for 31 analysts. However, AnaChart.com, which tracks recent analyst write-ups, reports that 36 analysts have an average of $20.80 per share as their price target. That is over 31% higher than Friday's close and is closer to my price target of $19.68. The bottom line is that the average of these analyst surveys is $17.97 per share, or +13.6% potential upside. What is the best way to play this. Let's look at this. Buying In-the-Money Calls and Shorting Out-of-the-Money PutsITM Calls. For example, the March 20, 2026, call option chain shows that the $13.00 call option contract has a midpoint price of $4.25. This contract expires 216 days from now, or over 7 months in the future. That strike price is $2.82 below Friday's close of $15.82, so it is 17.82% “in the money.” Effectively, it means an investor can control more shares than just buying LYFT stock outright. 
It also means that the investor is betting that LYFT stock will rise to at least $17.25 (i.e., $13.00 + $4.25) by 3/20/26. That is +9% higher than today's price. But given our projection that the stock is worth $19.68, that looks possible. In fact, if LYFT rises 24.4% to that target price, the investor would over double that amount, at least 57.2%: $19.68-13.00 = $6.68 intrinsic value $6.68 / $4.25 price paid = 1.572 = +57.2% upside OTM Puts. One way to pay for this call option purchase is to sell short (i.e., “Sell to Open”) one-month away put options in out-of-the-money (OTM) strike prices. That means the investor would have an obligation to potentially purchase shares at a significantly lower price. ' The idea is to set a low enough price that there is a low chance of having to buy in, but to collect a premium to help pay for the long call position. For example, the Sept. 19 put option contract at the $14.00 strike price has a midpoint premium of 21 cents. That means the investor can make an immediate yield of 1.50% (i.e., $0.21/$14.00) for the next month. This strike price is 11.5% below Friday's close of $15.82. Its delta ratio is very low at just 16.67%, implying less than a 17% chance that LYFT will fall to this price. 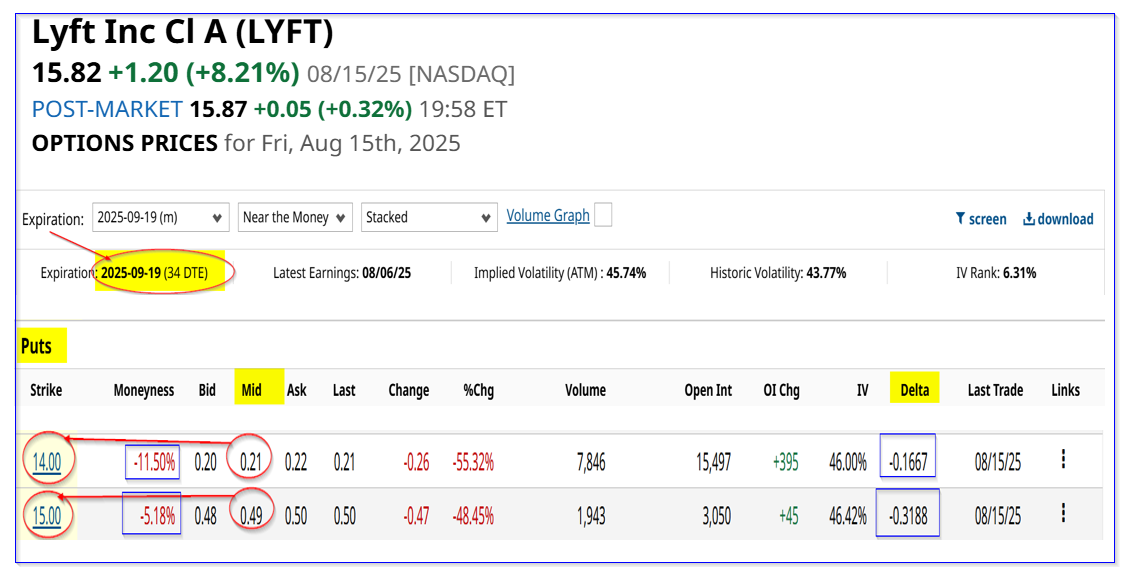
If an investor were to short the $15.00 strike price as well, the income would be 3.267% (i.e., $0.49/$15.00). So, using a mix of these two plays, an investor could potentially make between $1.47 and $3.34 over the next 7 months (assuming these plays can be repeated 7x). That would cover a good portion of the long call play above (i.e., $4.25 cost), and reduce the overall risk with that play. The bottom line here is that LYFT stock looks like it's very undervalued. One way to play it is to buy in-the-money calls, and/or short out-of-the-money puts. On the date of publication, Mark R. Hake, CFA did not have (either directly or indirectly) positions in any of the securities mentioned in this article. All information and data in this article is solely for informational purposes. For more information please view the Barchart Disclosure Policy here. |
|
|


